
What do you do when you know, with absolute certainty, that the infrastructure you’re running something on is unreliable? Hardware always fails eventually, networks go down, or software needs to be patched.
Even under perfectly ordinary operation, your runtime environment could drop out from under the running process: traffic drops, causing the autoscaler to downscale and, unless you’ve tied into the termination lifecycle, the process is forcibly killed. But whether purposeful or not, it’s a computing fact that processes can abruptly end and be restarted.
For many kinds of services, that’s perfectly acceptable; give the process a chance to drain outstanding requests, and then new requests will land on other nodes. Or, if that process unexpectedly dies or is forcibly ended, the client can retry and have its request handled elsewhere.
Put another way, things can be made “effectively reliable” from an infrastructure perspective: for example, Kubernetes helps ensure that nodes and processes exist to run application code, and Istio improves network reliability and performance. Things still fail, but we can make it tolerable with well-known tools.
But perhaps a more important question is: what’s actually being run? As in, what is the full application trying to accomplish?
An Example Application
Building something from the bottom up is a natural way to go; assume that things will fail (always a safe assumption), and design the system from there. But this makes it hard to build and keep track of a multi-step application, like an e-commerce store. Let’s take a look.
Consider how this application might look from the customer’s perspective. It’s a relatively short series of steps:
- Add item to cart
- Input payment
- Input shipping address
- Confirm and checkout
- Track order
- Receive item
Software engineering over the past couple of decades has taught us that nothing is simple. Namely, because we’ve made our infrastructures effectively reliable through tools like Kubernetes and patterns like stateless services, a “simple” workflow like the above ends up being composed of dozens of microservices (or more).
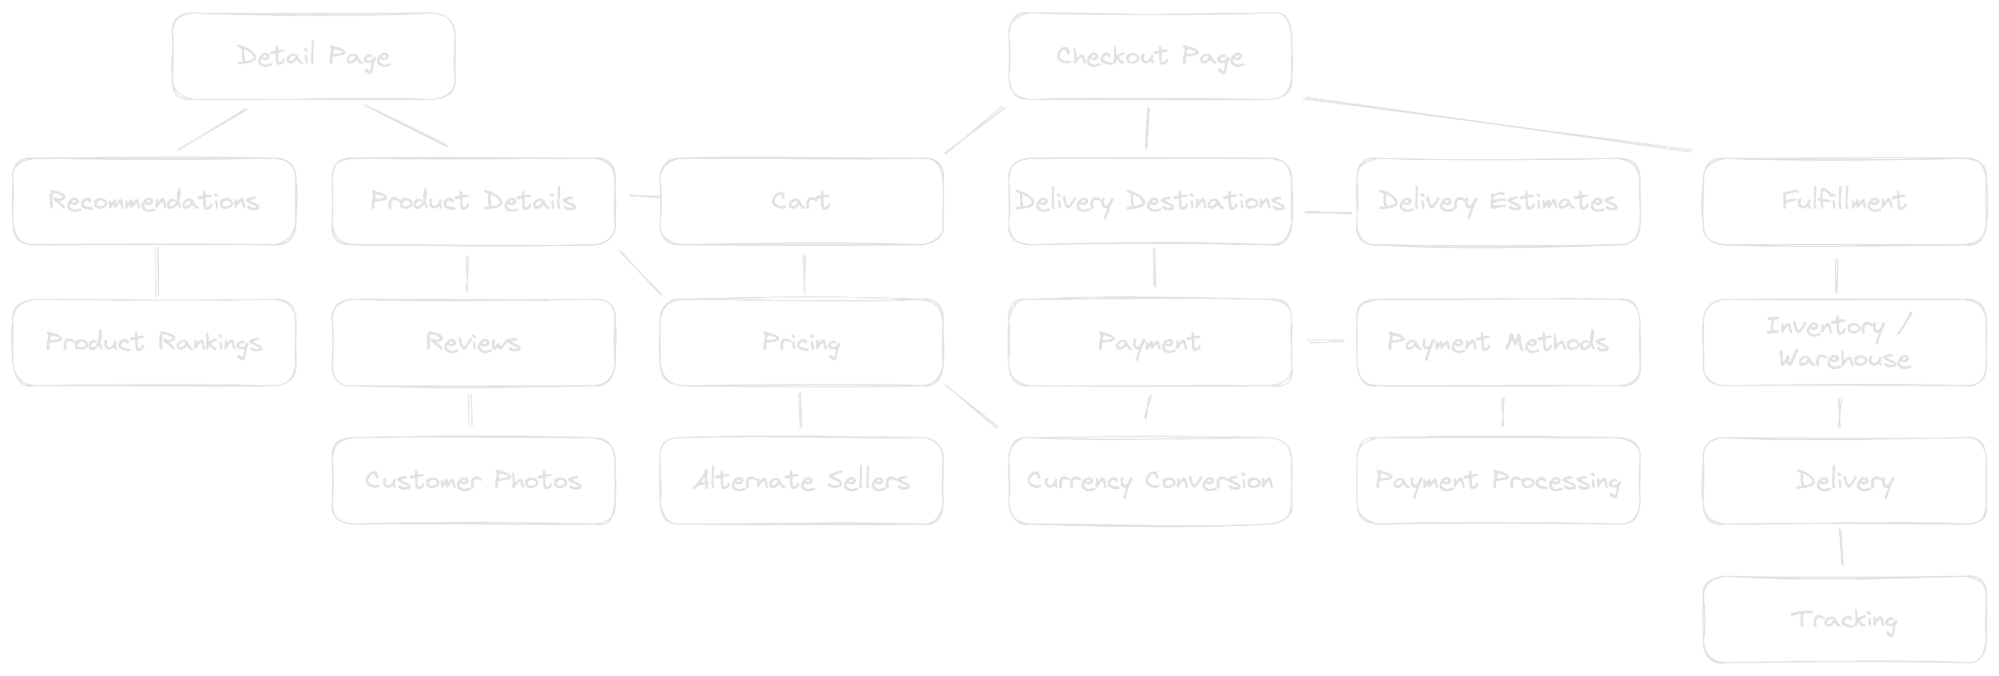 Caption: A hypothetical but realistic microservices connection graph for placing an e-commerce order.
That’s not all, though, because behind and in between these microservices also ends up being a complex mix of databases, caches, event streams, and message queues. While these services all have unique functions, they’re all dealing with the same orders, and hopefully each order’s details and status are appropriately picked up by the appropriate next service.
Thus, tracing a single order through this dizzying system becomes a daunting or even impossible task. While this is necessary for tasks like ensuring orders aren’t dropped, providing customer service, or auditing for regulatory compliance, it’s also important to answer a more fundamental question: How reliable is our application?
Applications Need Reliability Too
At some point, that question will come up. And I’m sure you’ve had the experience of trying to calculate some kind of overall reliability number, only to find that a single number like 99.99% doesn’t adequately represent the full story of the application.
Let’s take a look at a simplified example.
Suppose you have a two-step process, with each step handled by separate microservices. For the sake of example, let’s say the process is painting a bike shed, and the two steps are (1) choose and reserve a paint color and (2) apply paint to the shed. Step 2 cannot happen without Step 1 occurring first. But if we have two sheds, the microservices pattern allows the application to handle the two sheds independently from each other: Step 1 could be working on picking a paint color for Shed B without affecting Step 2’s painting of Shed A.

Reasoning about the reliability of this application is really asking: What is the likelihood of a given shed successfully making it through both steps?
For a serial system like this, the success probability is calculated as the product of the success probabilities for each individual step. So, if Step 1 has a 98% chance of success and Step 2 has a 99% chance, the overall probability of success (i.e., the “reliability” of the application) would be 0.99 * 0.98 = 0.9702, or ~97%.
You might note that this is actually worse than “the weakest link.” You can think of the product here as a logical and: both microservices must succeed in order for an overall success to occur. Even though we have a 98% chance of successfully painting the shed, the overall process could still fail if the committee deadlocks on making a decision in Step 1.
Aside: This then effectively proves what most of us intuitively know to be true. If you add more components to a system, its overall reliability goes down, even if each individual component has a success probability of ”five nines.” Said system would have an overall chance of success of .99999 ^ n, where n is the number of services (assuming they’re in serial). Meaning, just adding a third service to our example (say, splitting out choosing the paint color versus procuring the actual paint) reduces the chance of success to four nines, about .99997 or the equivalent of one failure out of every 33,333. [^1]
You can make the story a little bit better by adding redundancy to each step.
Even if the backup services are wildly unreliable, it still improves the overall reliability, which is calculated as:
Reliability of step 1 (R1) = 1 - (1 - .99) * (1 - .5) = 0.995
Reliability of step 2 (R2) = 1 - (1 - .98) * (1 - .6) = 0.992
Overall reliability = R1 * R2 = .98704
That 98.7% chance of success is certainly better than our 97% chance from earlier, but it does come with the extra operational cost of running secondary services.
Why is this important?
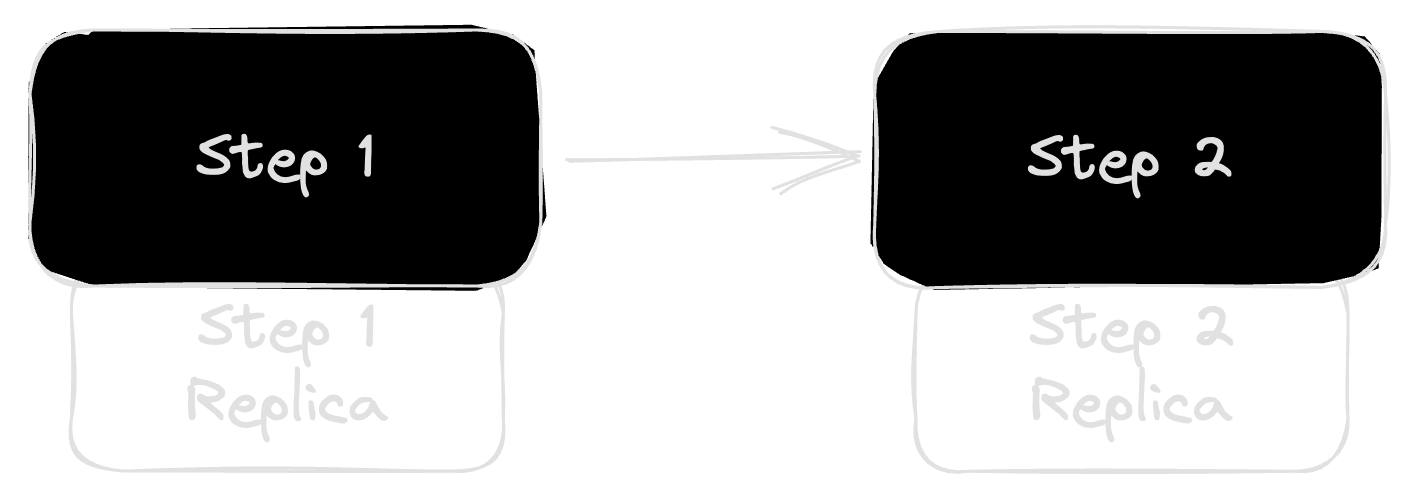
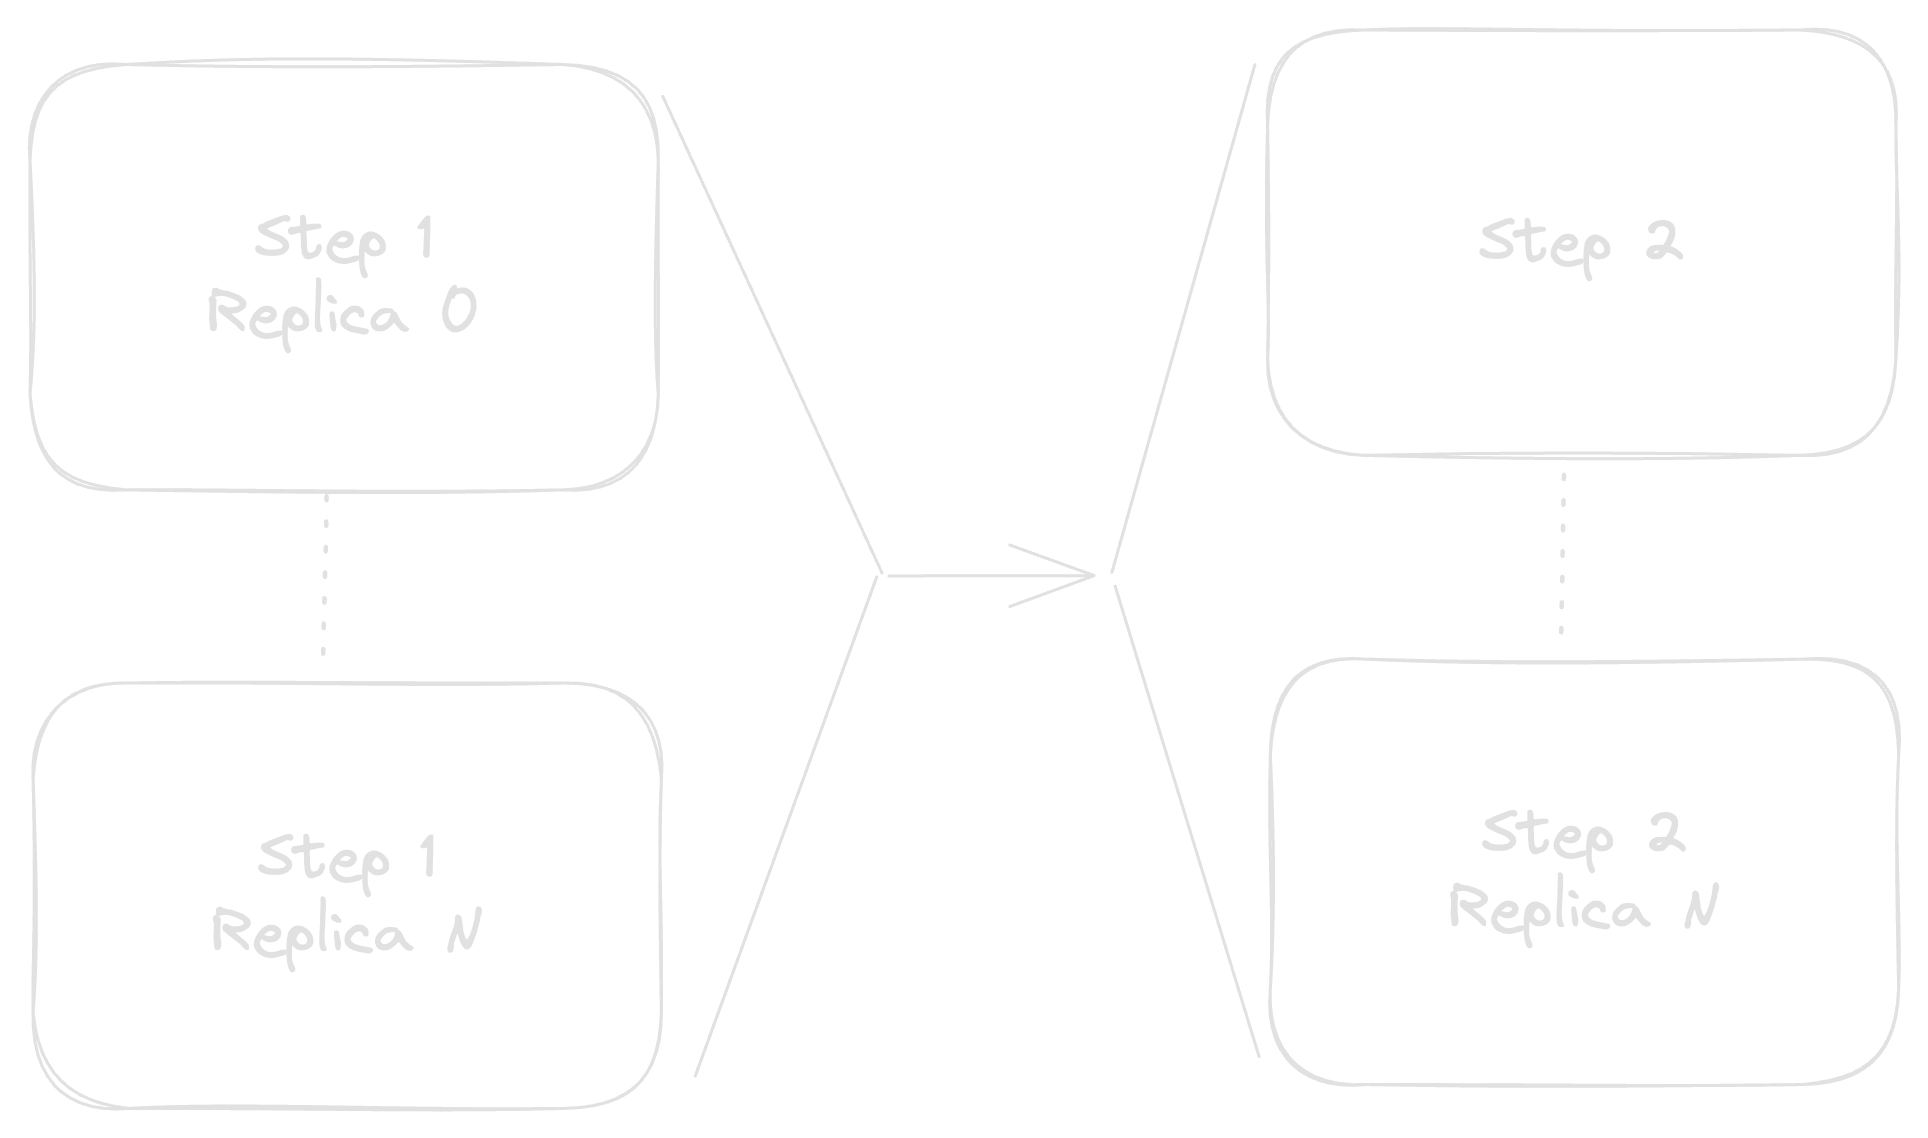
Part of the reason for splitting things out into microservices in the first place is to allow Step 1 to process as many requests as it can independently of Step 2 and vice-versa. To scale this, you might replicate each service as many times as needed, such that you have N instances of Step 1’s service, and M instances of Step 2’s.
While this improves our overall reliability number, we’ve introduced a new complication.
When the application was just two services wired in serial, once Step 1 was finished it could directly notify Step 2 and then move on to the next incoming request. Each service could maintain its own queue of requests (with possible persistence) and very little other coordination would be needed.
Unfortunately, that pesky little parenthetical tucked in there is the culprit of our complications. The “possible persistence” of a request queue is helpful if you want to not lose requests in the face of, e.g., process restarts. But, it’s absolutely required once you scale out beyond n = 1 instances of the service so that each request can be handled effectively once.
For short-lived requests, this could be handled by some kind of load balancer in front of each step:
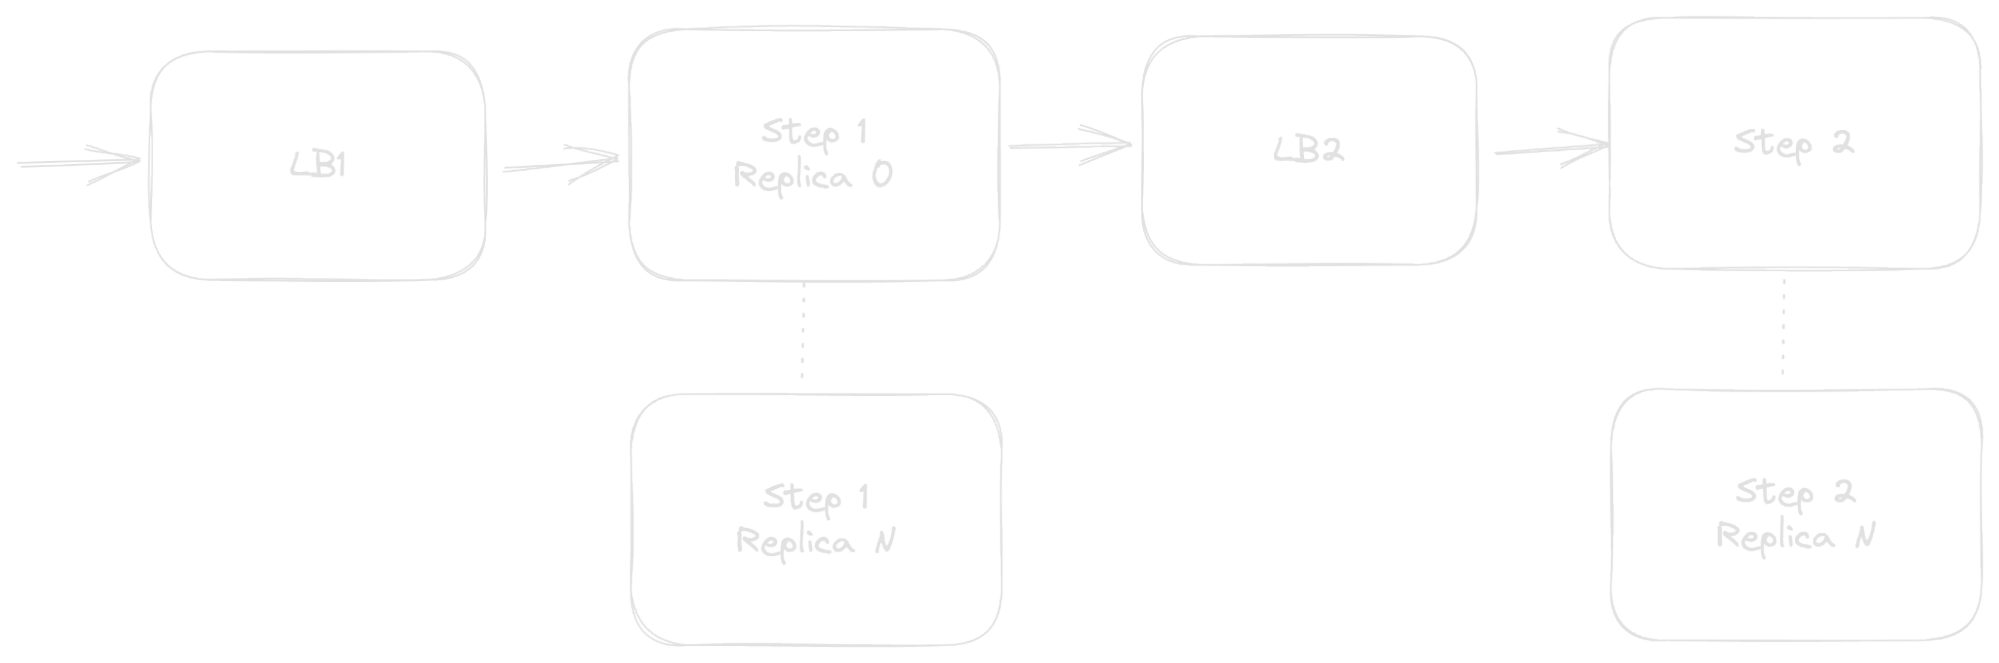
The load balancers act as the request queues, divvying requests out to workers as appropriate.
The side effect is that we’ve now doubled the number of components in the system. Load balancers can fail just like any other service, and so the system reliability becomes
R LB1 * R 1 * R LB2 * R 2
As discussed in the aside earlier, if all four of these services have a five-nines (99.999%) chance of successfully processing a given request, then the overall reliability is .999994 = 0.99996 or an equivalence of one out of every 25,000 requests failing. That may not seem too bad, but without those load balancers, the success rate would have been .999992 = .99998 or a failure rate of one per 50,000. Doubling the number of services in the sequence also doubled our failure rate.
So, naturally, let’s remove one of the load balancers and instead put a cache, database, or message queue in between:
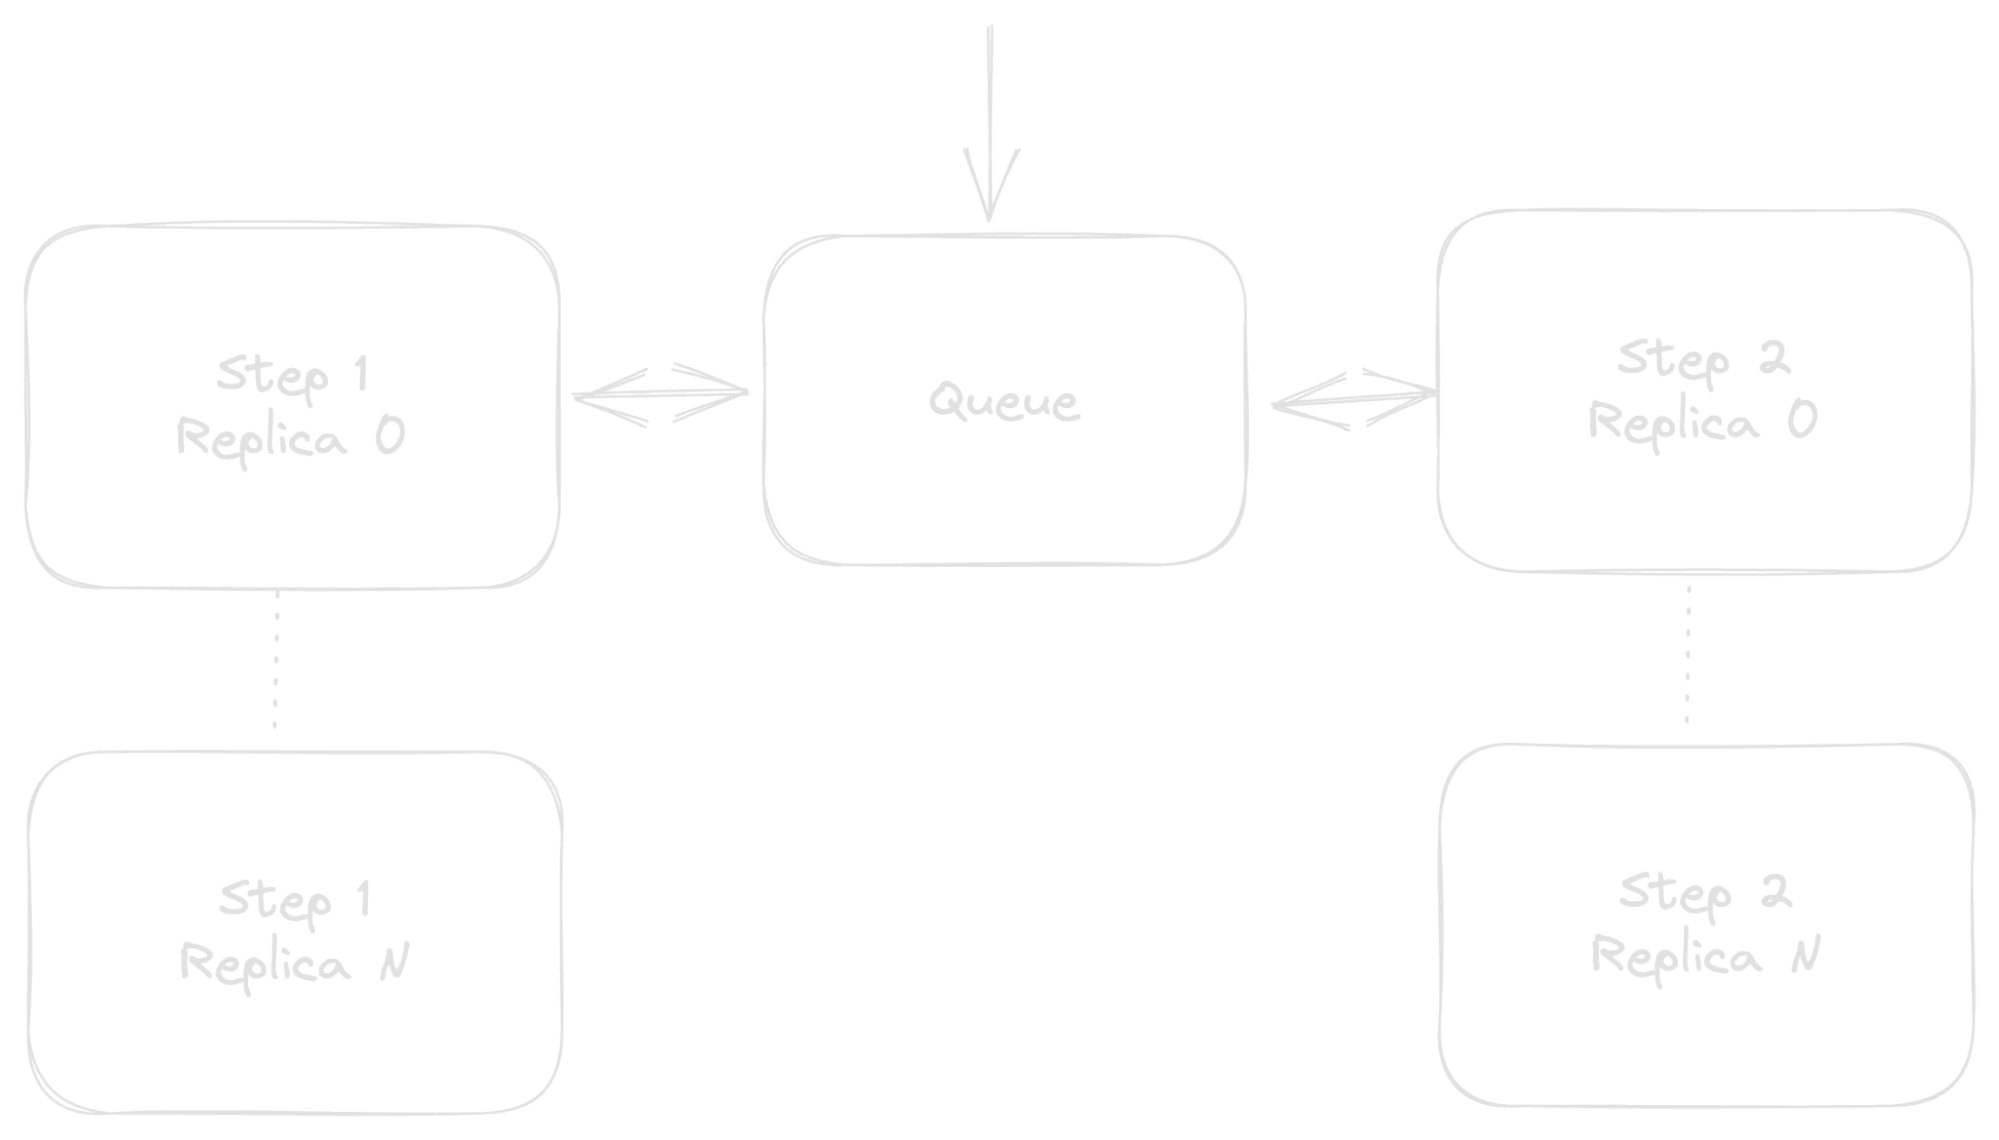
This intermediate queue provides a central place for keeping track of where your various sheds are in their painting lifecycles. That lifecycle is still somewhat disjointed though, and your components (Steps 1 and 2 and the Queue) are still very much wired in serial in a way that one outage affects an untold number of sheds—which ones and how is anyone’s guess.
Answering the Bigger Questions
This brings us, finally, back to the original question, “How reliable is the application?” The previous section described how to calculate the reliability of an overall system. Being able to say that the combined success rate of all services in the system is X% sort of answers the application-reliability question, but only does so from a fairly conceptual level.
More specifically, while it tells you how often any one random request will fail, it doesn’t answer questions like “Where is this request?” or “Where did this request fail?” or “Is this request going to eventually unstick itself or does a human need to step in?”
That is to say, if you’re looking at the aforementioned collection of microservices in an e-commerce system and wondering where a particular order is in its lifecycle (footnote: because, for example, you’re building a frontend for customer service agents), well… good luck.
Building Reliable Applications With Temporal
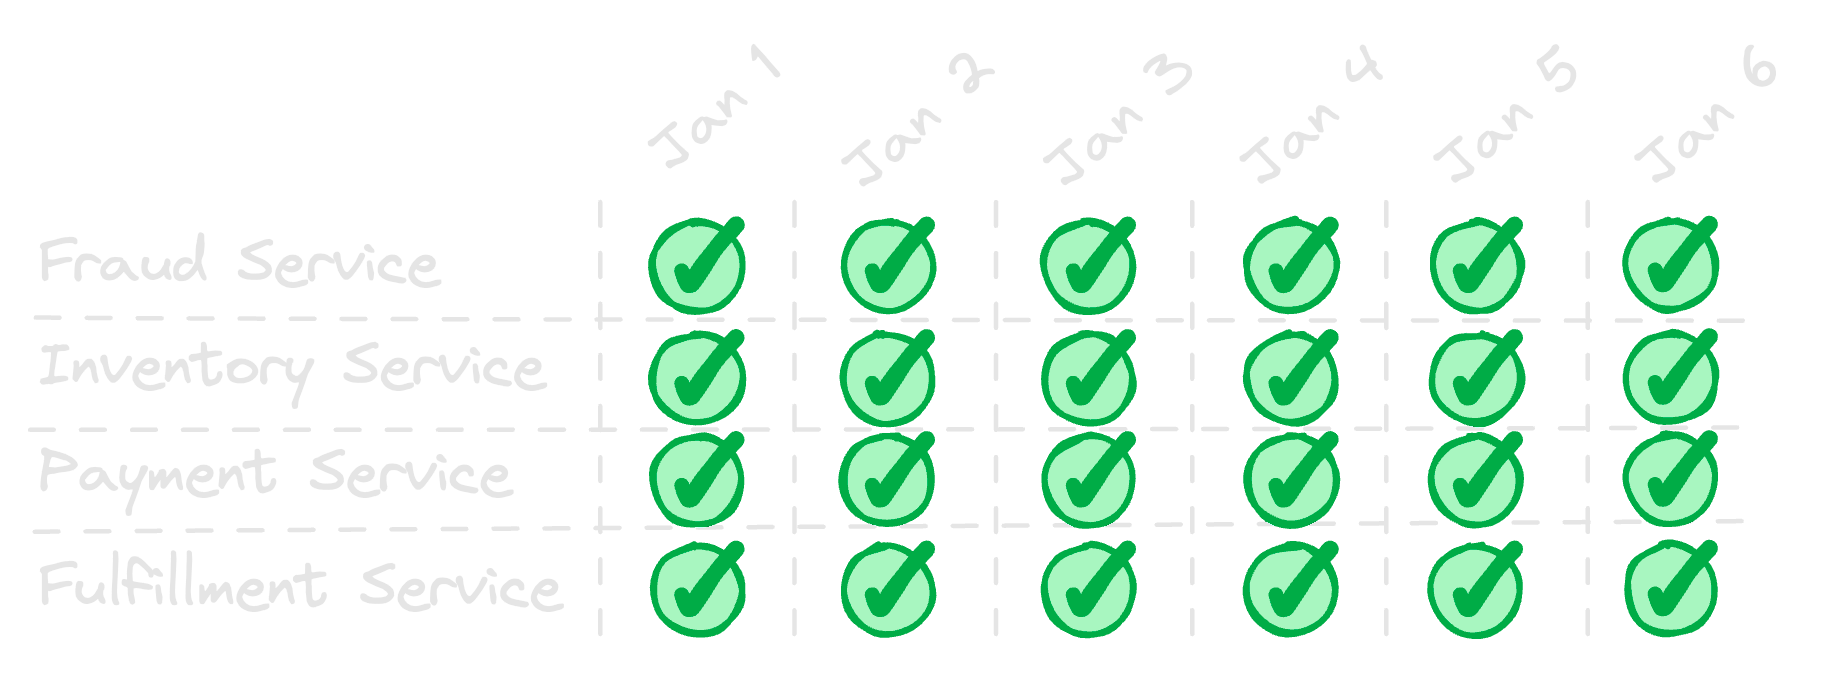
Having a single number representing the reliability of a system isn’t nearly as important as understanding what to do when unexpected things happen (as they always will). And, seeing all green across a status dashboard feels delightful.
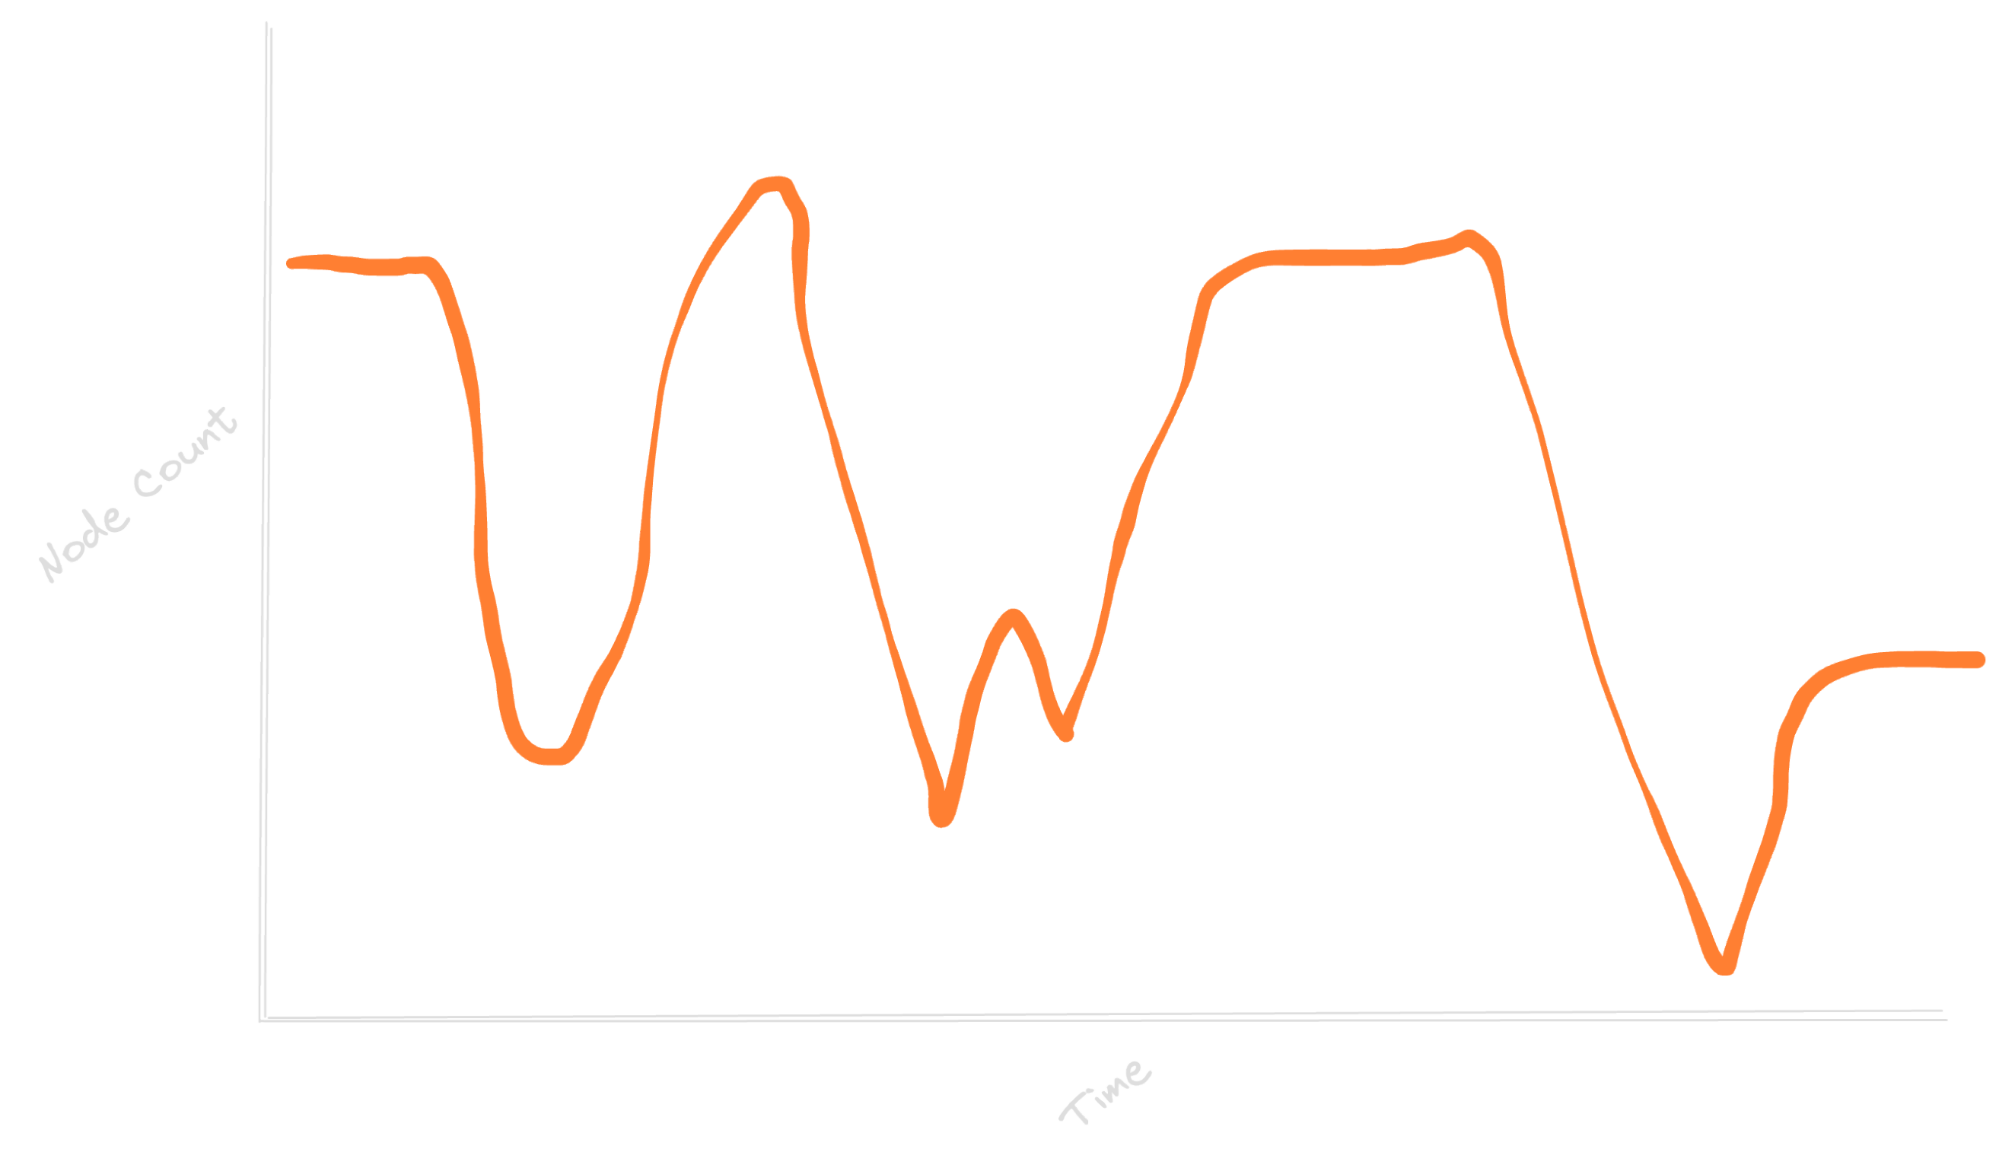
Suppose one of your services is backed by a load-balanced cluster of nodes. What’s the impact on customer experience if a misconfiguration in your autoscaler causes a repeated up-then-down scaling?
Sure, it’s a problem worth investigating, but with Temporal you don’t have to worry too much about the end-user impact: each user request could match to a Temporal Workflow, which is automatically resumed on another process where it left off if something interrupts the original process it’s running on.
So for example, consider a simplified user flow through your system that looks like:
- Check fraud
- Validate inventory
- Process payment
- Dispatch / Ship
If each of these is a separate microservice, and one of them is having infrastructure problems, you might be tempted to declare, “Oh no! This whole application is unreliable now!” After all, we saw earlier in this post that the weakest link in the chain tanks your overall reliability numbers.
With Temporal, instead of coming in with the assumption that each individual service needs to be made as reliable as possible, we take it a level higher. What if we assumed that dependent services will always fail, and we instead work to make the application reliable?
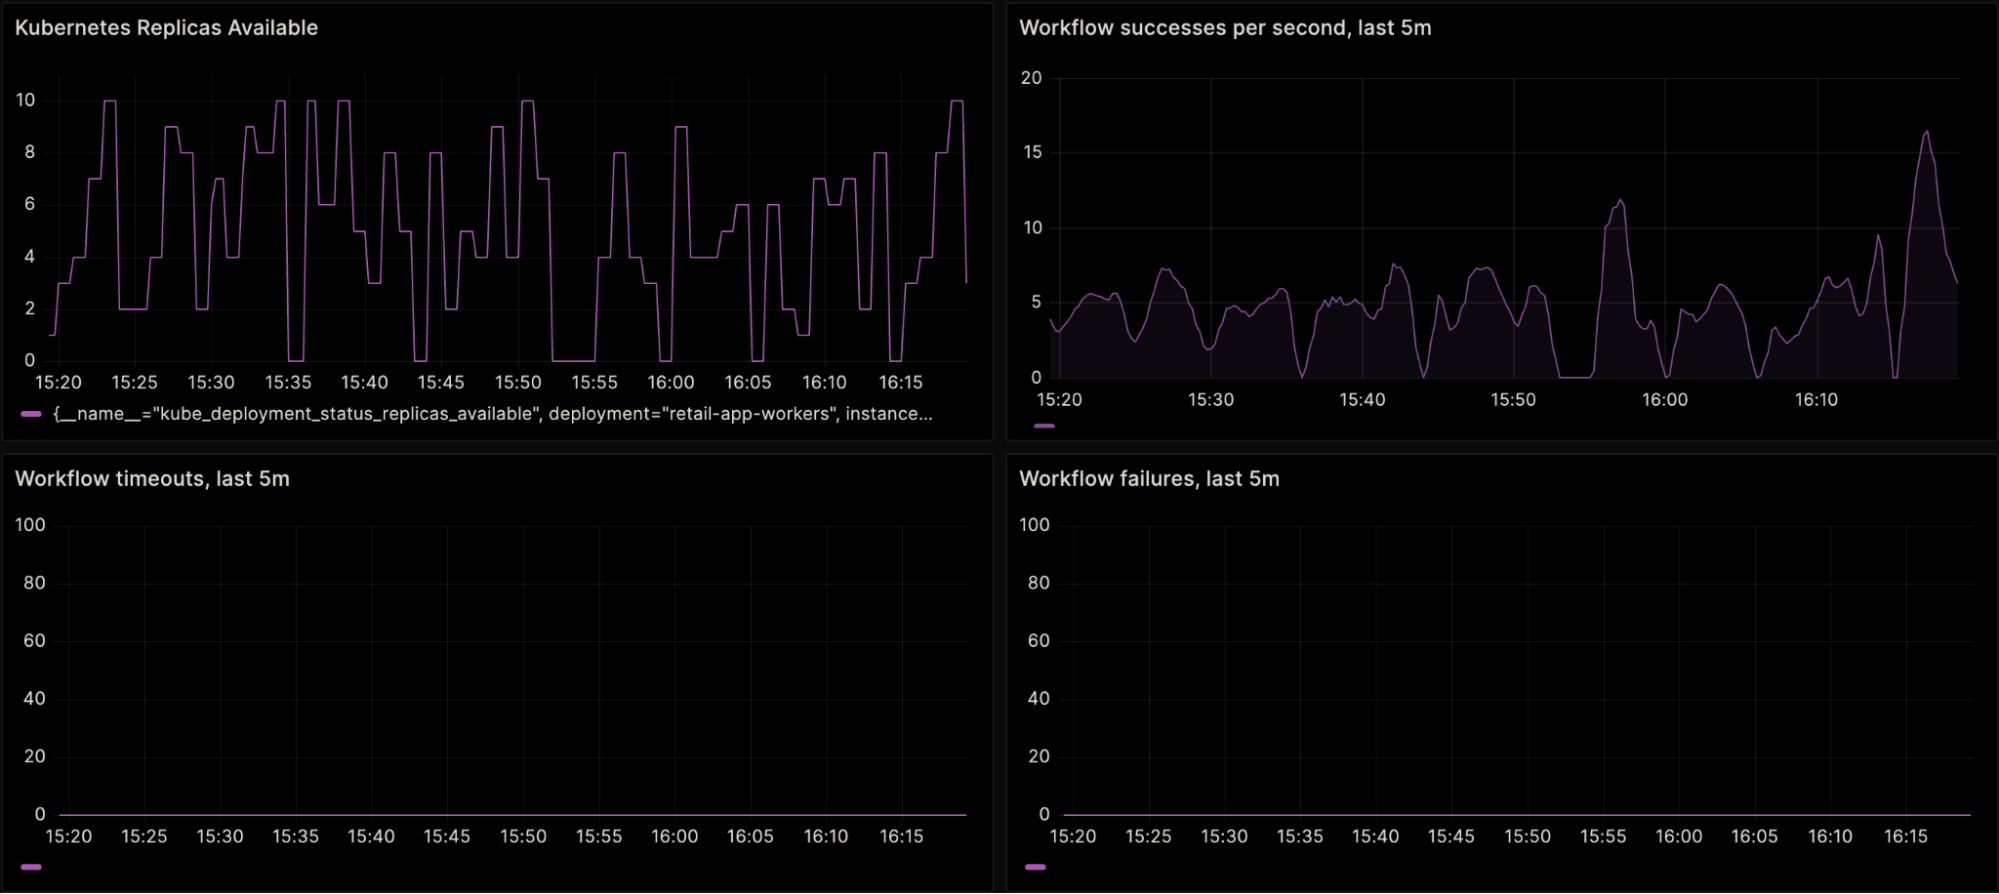 Caption: Four graphs of a demo Temporal application. Top left: the number of active Kubernetes replicas for the Worker fleet; randomly re-sized between 0 and 10. Top right: Workflow successes per second for this application. Bottom left and right: Workflow timeouts and failures, respectively, both flat at zero.
In these example graphs, depicting a demo Workflow running a simulated load (upper right graph), the Kubernetes cluster (upper left) responsible for actually running the Workflow (as in, the Worker fleet) is concurrently being randomly scaled up or down. This random scaling is to simulate unreliable infrastructure.
Measuring the uptime of this application from the infrastructure perspective – for example, how often are there no Workers available – leads to a pretty bleak number. Roughly calculated, the graph above represents an hour-long window. For a total of eight minutes during that hour, the cluster had no replicas available. 52 / 60 * 100 = 86.666% uptime, or in other words: zero nines.
But, take a closer look at the other graphs. While the rate of Workflow successes dipped to zero during the infrastructure downtime, they did still continue to succeed: Workflow timeouts and Workflow failures remained flat at zero.
With a Workflow as the thing we’re measuring the reliability of, the calculation of reliability over the hour looks much nicer:
	sum(timeouts_per_second) (T) = 0
	sum(failures_per_second) (F) = 0
	sum(successes_per_second) (S) = 685

	Application reliability = 1 - (T + F) / S = 1 = 100%
That is to say, even with much worse reliability than you’d like, Temporal gives you better overall application reliability.
Summary
Perhaps obviously, the example used here is contrived, but it’s not that far from reality with Temporal. Microservices and external dependencies will always fail at some point. Working to make them as reliable as possible is necessary and important work, but no service will ever truly hit 100% reliability over a sufficiently long period of time.
To mitigate that, consider why services exist in the first place: to provide a, well, service—a self-contained piece of functionality—to a bigger application. When you take a step back and consider the reliability of the bigger picture, rather than service-by-service, your whole application can be reliable while underlying services are inconsistent.
For more on Temporal, head over to our documentation and courses:
[^1]: Which, to be fair, is still a heck of a lot of successfully painted sheds.