
Request latency is an important indicator for the performance of Temporal Server. Temporal Cloud can offer reliably low request latencies, thanks to its custom persistence backend and expertly managed Temporal Server infrastructure. In this post, we’ll give you some tips for getting lower and more predictable request latencies, and making more efficient use of your nodes, when deploying a self-hosted Temporal Server on Kubernetes.
Tuning Temporal Server request latency on Kubernetes
When evaluating the performance of a Temporal Server deployment, we begin by looking at metrics for the request latencies your application, or workers, observe when communicating with Temporal Server. In order for the system as a whole to run efficiently and reliably, requests must be handled with consistent, low latencies. Low latencies allow us to get high throughput, and stable latencies avoid unexpected slowdowns in our application and allow us to monitor for performance degradation without triggering false alerts.
For this post, we’ll use the History service as our example, which is the service responsible for handling calls to start a new workflow execution, or to update a workflow’s state (history) as it makes progress. None of these tips are specific to the History service—most of them can be applied to all the Temporal Server services.
The curious case of the unexpected throttling
Generally, Kubernetes deployments will set CPU limits on containers to stop them from being able to consume too much CPU, starving other containers running on the same node. The way this is enforced is using something called CPU throttling. Kubernetes converts the CPU limit you set on the container into a limit on CPU cycles per 1/10th second. If the container tries to use more than this limit, it is “throttled”, which means its execution is delayed. This can have a non-trivial impact on the performance of containers, as it can increase request latency. This is particularly true for requests requiring CPU intensive tasks, such as obtaining locks.
For monitoring the Kubernetes clusters in our Scaling series (first post here) we use the kube-prometheus stack.
In contrast to the 1/10th second used to manage CPU throttling, the Prometheus system uses an interval of 15 seconds or more between scrapes of aggregated CPU metrics. The large difference in intervals between the throttling period and the monitoring scraping interval means that CPU throttling can be occurring even if CPU usage metrics are reporting a long way under 100% usage. For this reason, it’s important to monitor CPU throttling specifically.
Here is an example for the History service:

We can see from the dashboard that although the history pods’ CPU usage is reporting below 60%, it is being throttled.
In kube-prometheus setups, you can use this Prometheus query to check for CPU throttling, adjusting the namespace and workload selectors as appropriate:
sum(
    increase(container_cpu_cfs_throttled_periods_total{job="kubelet", metrics_path="/metrics/cadvisor", container!=""}[$__rate_interval])
    * on(namespace,pod)
    group_left(workload, workload_type) namespace_workload_pod:kube_pod_owner:relabel{namespace="temporal", workload="temporal-history"}
)
/
sum(
    increase(container_cpu_cfs_periods_total{job="kubelet", metrics_path="/metrics/cadvisor", container!=""}[$__rate_interval])
    * on(namespace,pod)
    group_left(workload, workload_type) namespace_workload_pod:kube_pod_owner:relabel{namespace="temporal", workload="temporal-history"}
) > 0
So, how can we fix the throttling? Later we’ll discuss why you should probably stop using CPU limits entirely, but for now, as Temporal Server is written in Go, there is something else we can do to improve latencies.
GOMAXPROCS in Kubernetes
GOMAXPROCS is a runtime setting for Go that controls how many processes it’s allowed to fork to provide concurrent processing. By default, Go will assume that it can fork a process for each core on the machine it’s running on, giving it a high level of concurrency.
On a Kubernetes cluster, however, containers will generally not be allowed to use the majority of the cores on a node, due to CPU limits. This mismatch means that Go will make bad decisions about how many processes to fork, leading to inefficient CPU usage. It will (among other things) have to run garbage collection and other housekeeping tasks on CPU cores that it isn’t able to use for any useful amount of real work. As an example: on our Kubernetes cluster, the nodes have 8 cores, but our history pods are limited to 2 cores. This means they may create up to 8 processes, but across those 8 only be able to use a total of 2 cores’ share of cycles in every throttling period. It then becomes easy for the container’s processes to starve each other of allowed CPU cycles.
To fix this, we can let Go know how many cores it’s allowed to use by setting the GOMAXPROCS environment variable to match our CPU limit. Note: GOMAXPROCS must be an integer, so you should set it to the number of whole cores you set in the limit. Let’s see what happens when we set GOMAXPROCS on our deployments:
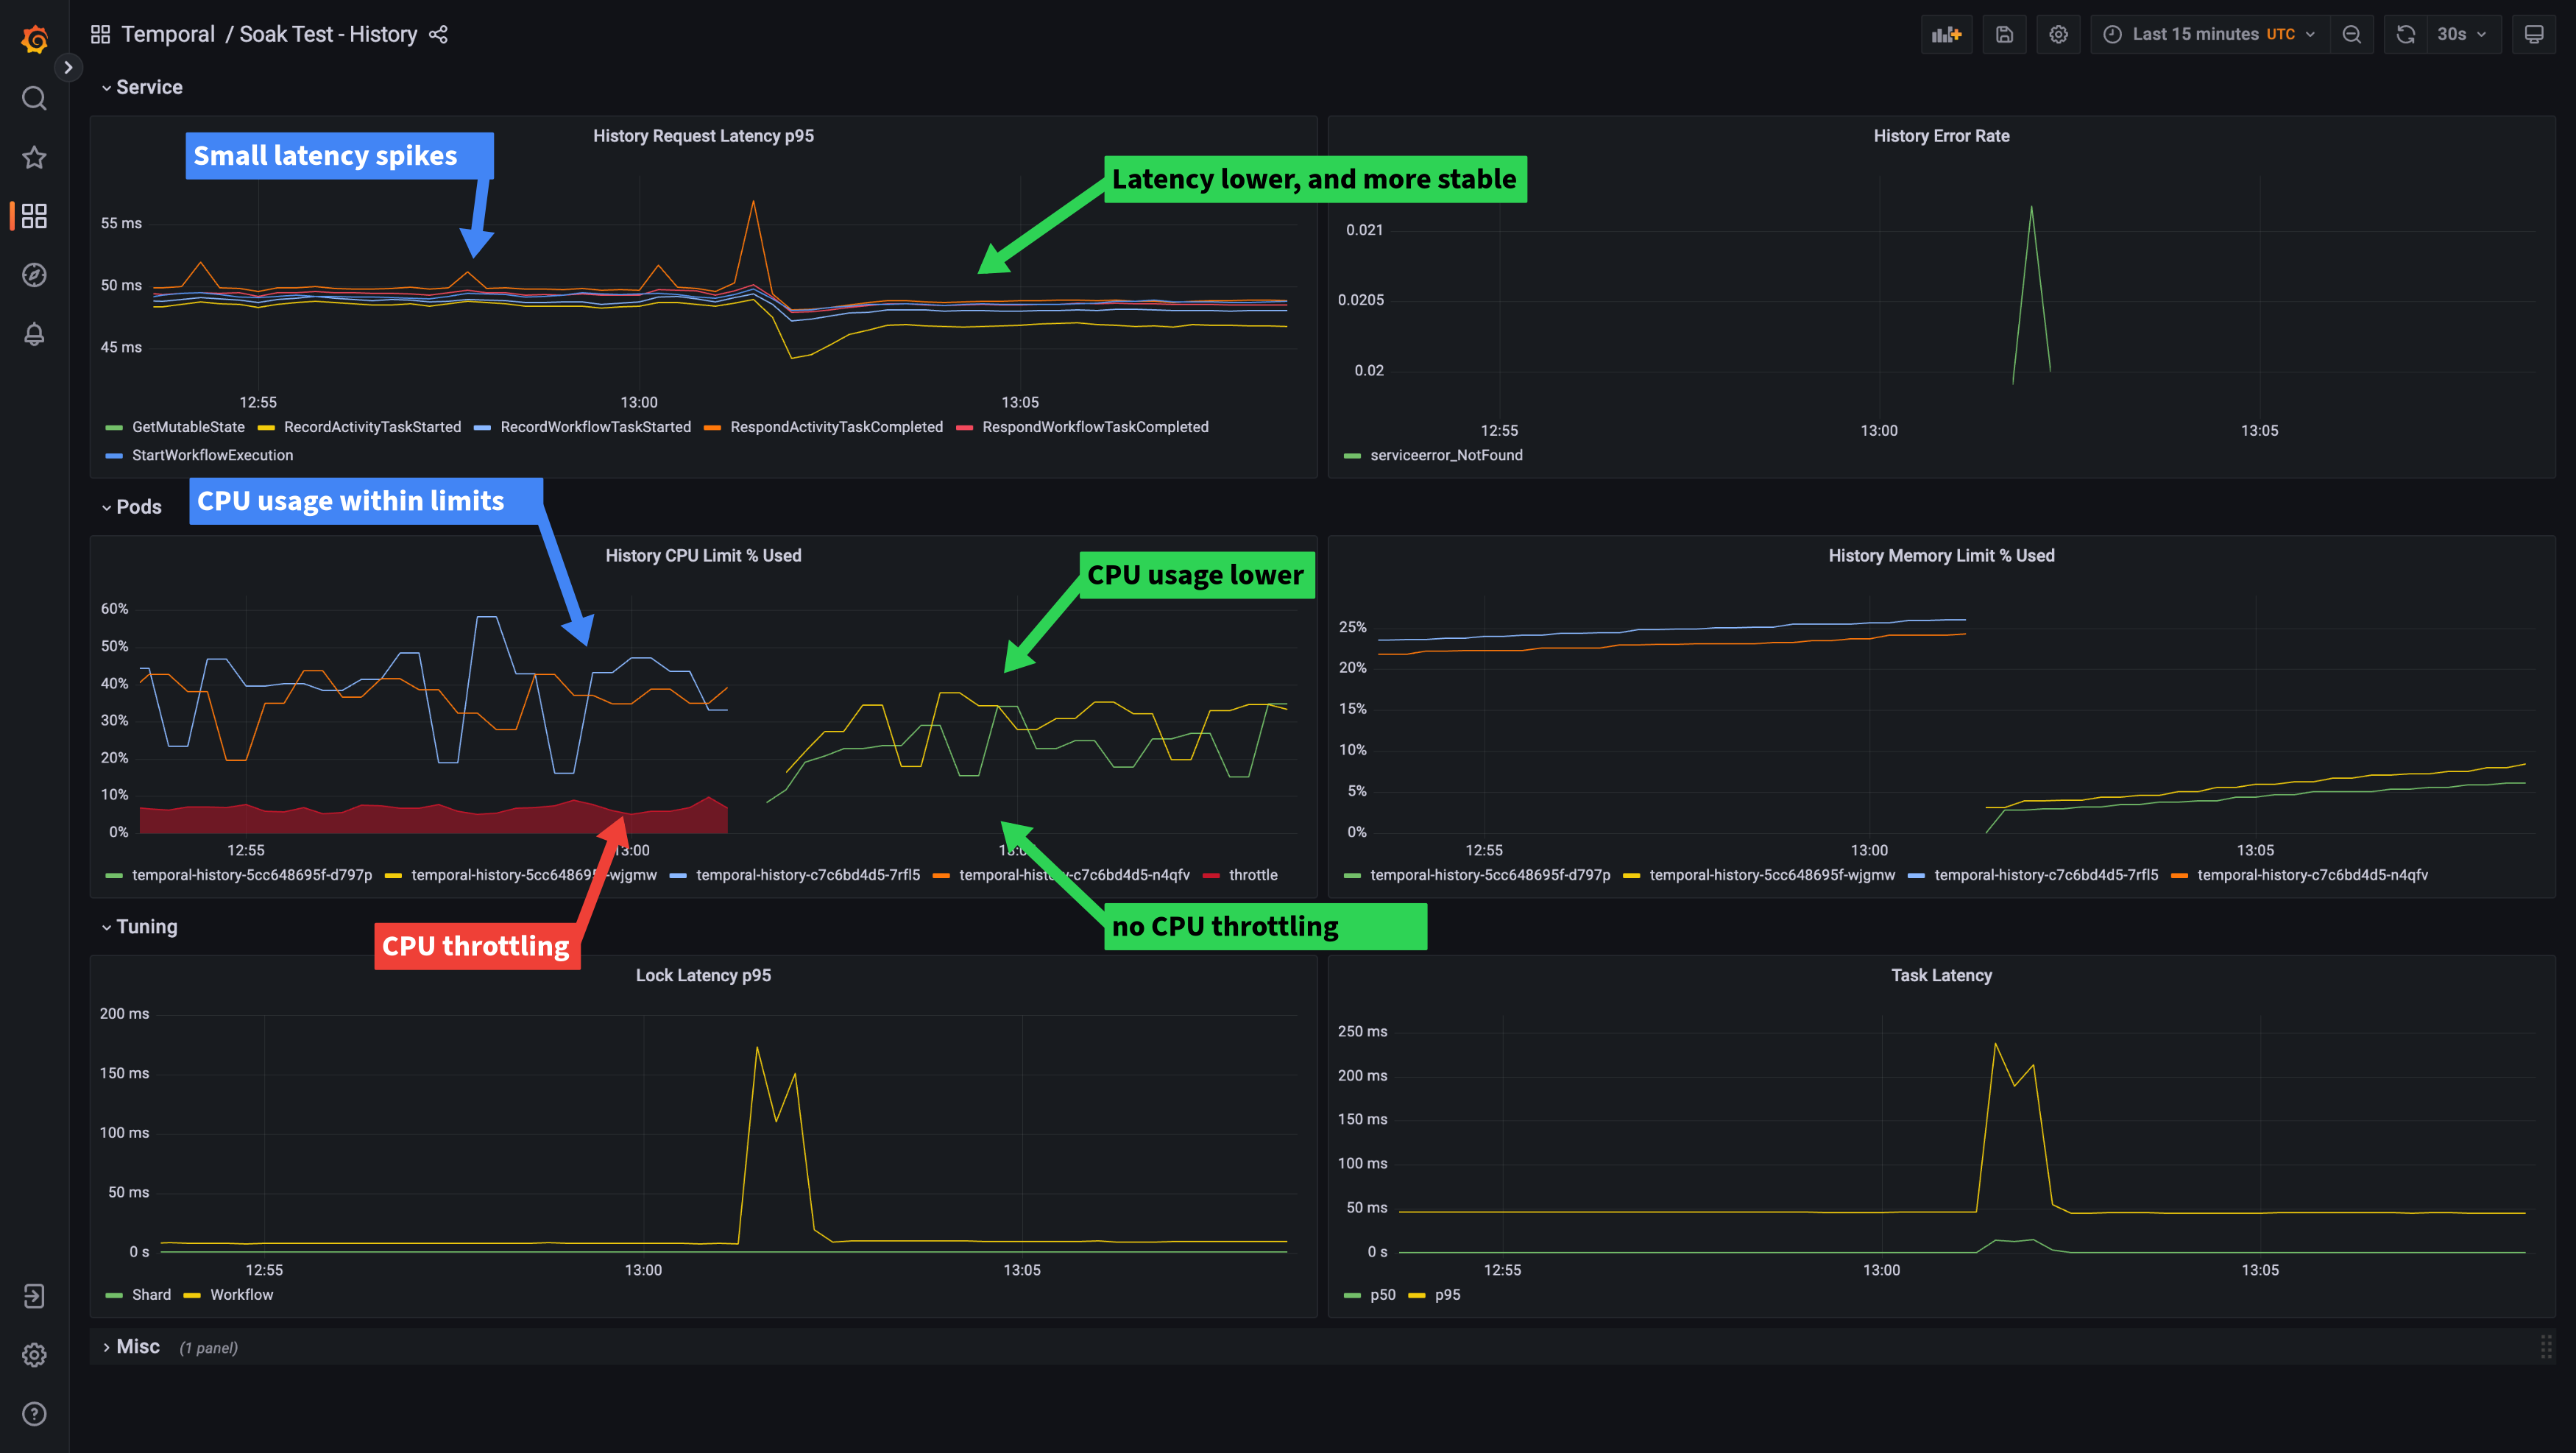
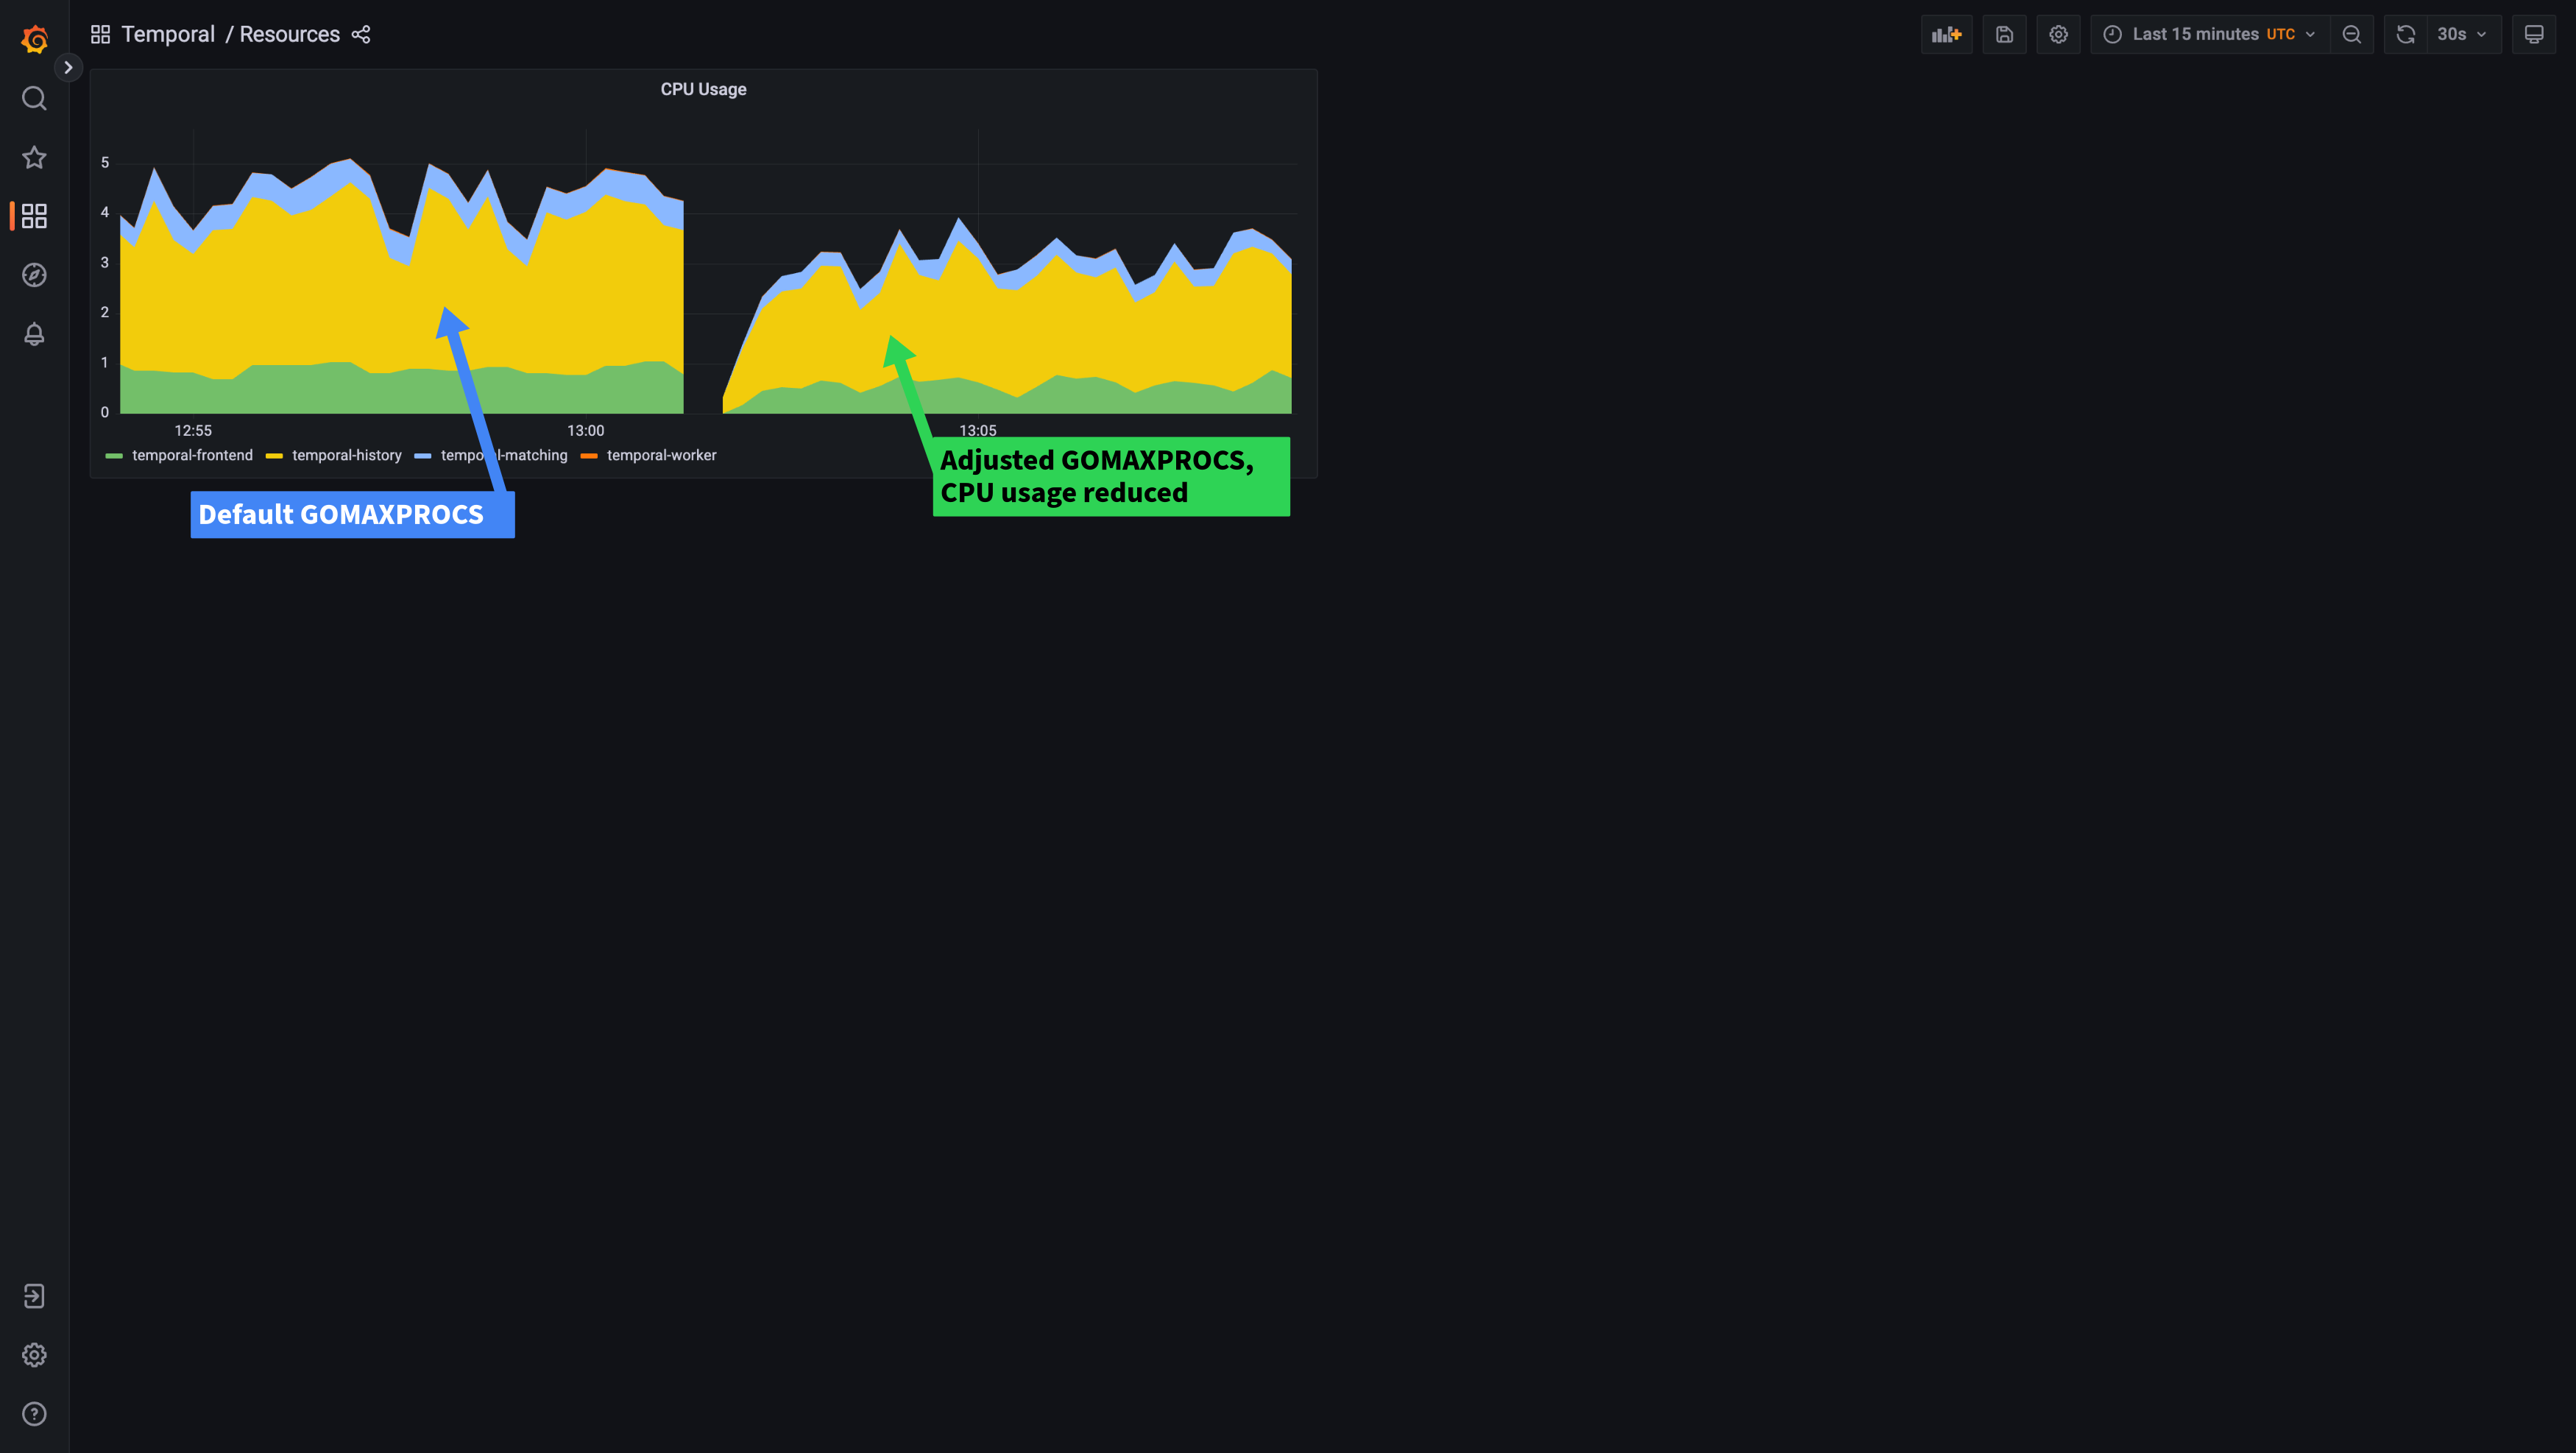
On the left of the graphs, you can see the performance with the default GOMAXPROCS setting. Towards the right, you can see the results of setting the GOMAXPROCS environment variable to “2”, letting Go know it should only use at most 2 processes. CPU throttling has gone entirely, which has helped make our latency more stable. We can also see that because Go can make better decisions about how many processes to create, our CPU usage has lowered, even though performance has actually improved slightly (request latency has lowered). Here, you can see how the CPU across all Temporal services drops after adjusting GOMAXPROCS:
To help give a better experience out of the box, from release 1.21.0 onwards, Temporal will automatically set GOMAXPROCS to match Kubernetes CPU limits if they are present and the GOMAXPROCS environment variable is not already set. Before that release, you should manually set the GOMAXPROCS environment variable for your Temporal Cluster deployments. Also note that GOMAXPROCS will not automatically be set based on CPU requests, only limits. If you are not using CPU limits, you should set GOMAXPROCS manually to close to (equal or slightly greater) than your CPU request. This allows Go to make good decisions about CPU efficiency, taking your CPU requests into consideration.
Which brings us nicely to our second suggestion…
CPU limits probably do more harm than good
Now that we’ve improved the efficiency of our CPU usage, I’m going to echo the sentiment of Tim Hockin (of Kubernetes fame) and many others and suggest that you stop using CPU limits entirely. CPU requests should be closely monitored to ensure you are requesting a sensible amount of CPU for your containers, so that Kubernetes can make good decisions about how many pods it assigns to a node. This allows containers that are having a CPU burst to make use of any spare CPU on the node. Make sure to monitor node CPU usage as well—frequently running out of CPU on the node tells you that pods are bursting more often than your requests allow for, and you should re-examine their CPU requests.
If you can’t disable limits entirely as they enforce some business requirements (customer isolation for example), then consider dedicating some nodes to the Temporal Cluster and use taints and tolerations to pin the deployments to those nodes. This allows you to remove CPU limits from your Temporal Cluster deployments while leaving them in place for your other workloads.
Avoiding increased latency from re-balancing during Temporal upgrades
Temporal Server’s History service automatically balances history shards across the available history pods, this is what allows Temporal Cluster to scale horizontally. Note: Although we use the term balance here, Temporal does not guarantee that there will be an equal number of shards on each pod. The History service will rebalance shards every time a new history pod is added or removed, and this process can take a while to settle. Depending on the scale of your cluster, this rebalancing can increase the latency for requests, as a shard cannot be written to while it is being reassigned to a new history or pod. The effect of this will vary depending on what percentage of shards each of the pods is responsible for. The fewer pods you have, the greater the effect on latency when they are added/removed.
The latency spike during a rollout can be mitigated in two ways, depending on the number of history pods you have:
If you have more than 10 pods, the best option will be to do rollouts slowly, ideally one pod at a time. You can use low values for maxSurge and maxUnavailable to ensure pods are rotated slowly. Using minReadySeconds, or a startupProbe with initialDelaySeconds, can give Temporal Server time to rebalance as each pod is added.
If you have less than 10 pods, it’s better to rotate pods quickly so that rebalancing can settle quickly. You will see latency spikes for each change, but the overall impact will be lower. You can experiment with the maxSurge and maxUnavailable settings to allow Kubernetes to roll out more pods at the same time. The defaults are 25% for each, which for 4 pods would mean only 1 pod will be rotated at once. Your mileage will vary based on scale and load, but we’ve had good success with 50% for maxSurge/maxUnavailable on low (4 or less) pod counts.
Pull-based monitoring systems such as Prometheus use a discovery mechanism to find pods to scrape for metrics. As there is a delay between a pod being started and Prometheus being aware of it, the pod may not be scraped for a few intervals after starting up. This means metrics can report inaccurate values during a deployment, until all the new pods are being scraped.
For this reason, it’s best to ensure you are not using metrics that are emitted by the History service when evaluating History deployment strategies. Instead, SDK metrics such as StartWorkflowExecution request latency are a good fit here. Frontend metrics can also be useful, as long as the Frontend service is not being rolled out at the same time as the History service.
These same deployment strategies are also useful for the Matching service, which balances task queue partitions across matching pods.
Summary
In this post we’ve discussed CPU throttling, CPU limits, and the effect of rebalancing during Temporal upgrades/rollouts. Hopefully, these tips will help you save some money on resources, by using less CPU, and improve the performance and reliability of your self-hosted Temporal Cluster.
We hope you’ve found this useful, we’d love to discuss it further or answer any questions you might have. Please reach out with any questions or comments on the Community Forum or Slack. My name is Rob Holland, feel free to reach out to me directly on Temporal’s Slack if you like, would love to hear from you. You can also follow us on Twitter if you’d like more of this kind of content.